Data is everywhere. But raw numbers? Boring. What makes data pop is the way you present it—and that’s where D3.js shines.
Despite newer charting libraries hitting the scene, D3.js remains a go-to for serious, custom data visualizations. If you’re a web developer who wants total control over how data comes to life on screen, learning D3 in 2025 is still 100% worth it.
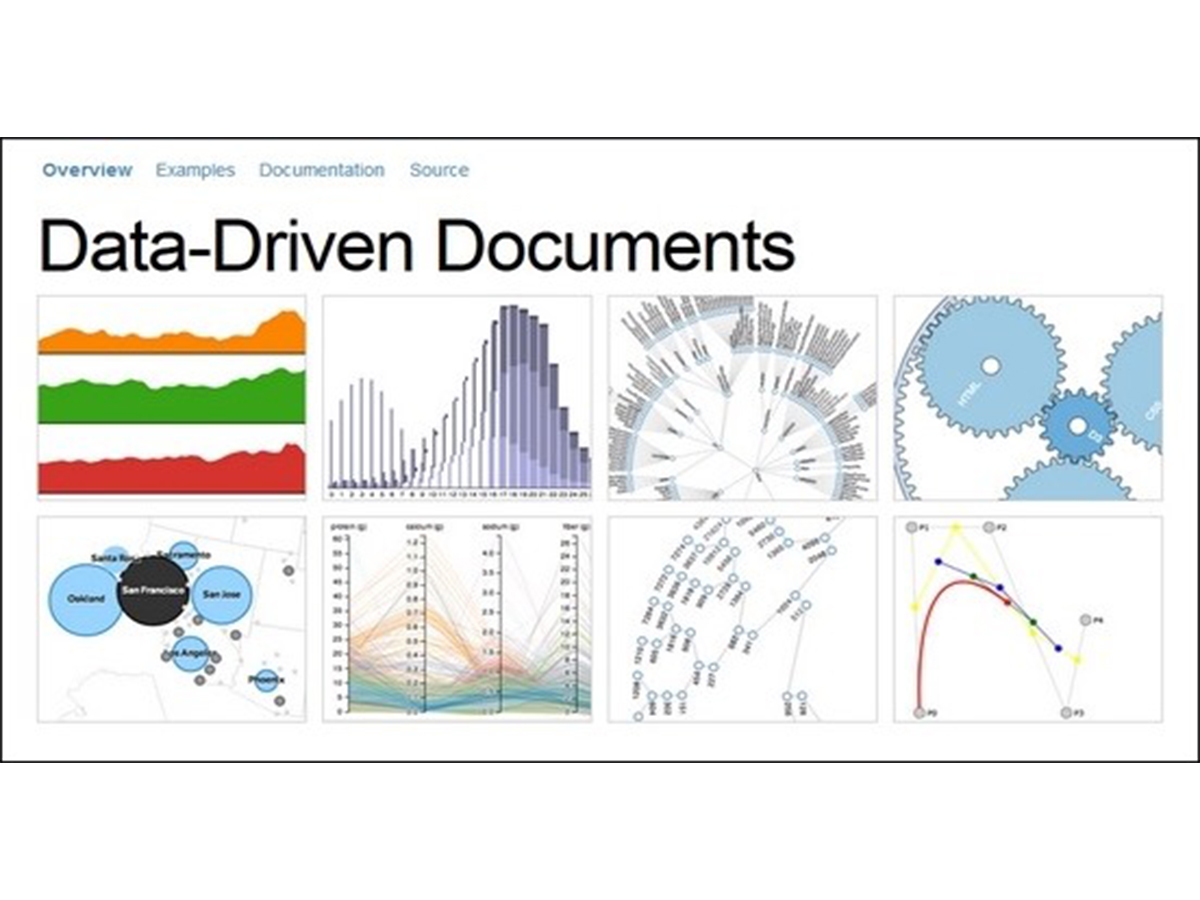
🌐 What is D3.js?
D3 (Data-Driven Documents) is a JavaScript library that lets you bind data to DOM elements and apply powerful transformations. It’s like giving your data a creative voice—whether that’s a bar chart, a complex dashboard, or an interactive story.
D3 gives you the building blocks. Unlike charting libraries like Chart.js or ApexCharts, D3 doesn’t give you ready-made charts—it gives you tools to build anything.
💡 Why D3 is Still Relevant in 2025
1. Flexibility + Control
D3 doesn’t box you in. Want to make a radial chart that morphs into a bar graph on hover? Or an animated map that reacts to real-time data? D3 can do that. It’s pixel-perfect control at your fingertips.
2. Integrates Well with Modern Frameworks
Using React, Vue, or Svelte? D3 pairs beautifully with component-based frameworks when you handle DOM updates the right way. In fact, combining D3’s math with modern rendering strategies gives you the best of both worlds.
3. Great for Storytelling
From newsrooms like The New York Times to major brands, D3 is behind many of the most compelling data stories. When you need more than just “a chart”—when you want narrative—D3 delivers.
4. Performance
With D3’s control over SVG, Canvas, and even WebGL, you can optimize large datasets and make interactions smooth, even with thousands of data points.
🚀 How to Start with D3 in 2025
If you’re new to D3, don’t worry—it has a learning curve, but it’s manageable with the right mindset.
Step 1: Learn the Basics
- Understand how selections work (
d3.select,d3.selectAll) - Learn about scales, axes, and data binding
- Try building a simple bar chart with static data
Step 2: Move Into Interactivity
- Add transitions and hover effects
- Create dynamic charts that update with real-time data
Step 3: Explore Layouts and Maps
- Try
d3.forceSimulation()for network graphs - Use
d3.geofor mapping and spatial data
Step 4: Integrate with Frameworks
- Use React with D3 via refs or hooks
- Explore hybrid approaches: D3 for math, React for rendering
📦 Handy Resources
Final Thoughts
D3 isn’t always the quickest way to build a chart—but it’s often the best when you need flexibility, beauty, and depth. Whether you’re a data nerd, a creative coder, or a dev looking to level up, D3 opens doors to visual storytelling like no other tool.
In 2025, data visualization is more essential than ever—and D3.js is still leading the way.